Introduction
Gamma Exposure (GEX) has become an increasingly important metric in modern options trading, providing traders with valuable insights into potential market movements and volatility. This article explores how GEX levels influence market dynamics and how traders can utilize this information in their trading strategies.
What is Gamma Exposure (GEX)?
Gamma Exposure represents the theoretical dollar value change in market makers’ delta positions for every 1% move in the underlying asset’s price. In simpler terms, it measures how much market makers need to buy or sell the underlying asset to maintain delta-neutral positions as prices change.
Key Components of GEX
1. Positive vs. Negative GEX
Positive GEX: Creates resistance to price movement
- Market makers sell into strength
- Buy into weakness
- Results in mean-reverting price action
Negative GEX: Amplifies price movement
- Market makers buy into strength
- Sell into weakness
- Can lead to trending price action
2. GEX Levels and Market Impact
High GEX Levels
- Indicate potential price stability
- Create “sticky” price points
- Often occur near major option strike prices
- Can act as support/resistance levels
Low GEX Levels
- Signal potential for larger price moves
- Indicate less market maker influence
- Can precede periods of increased volatility
- Present opportunities for trend-following strategies
GEX Visualization in NinjaSpread Platform
Options Risk Curve Integration
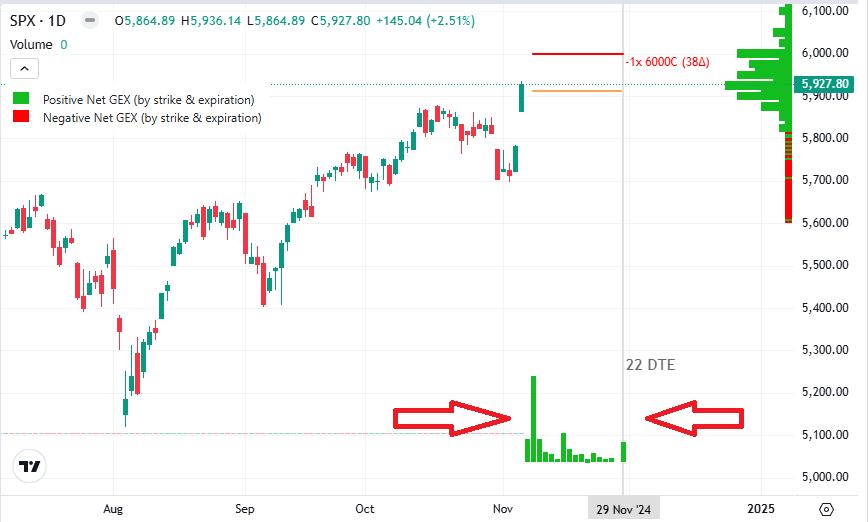
NinjaSpread provides a sophisticated visualization system that combines traditional options risk analysis with GEX levels. The platform displays:
- Options risk curve showing potential profit/loss scenarios
- TradingView chart integration for technical analysis
- Overlay of crucial option parameters:
- Strike prices
- Breakeven points
- Expiration dates
- GEX levels
Dual-Axis GEX Analysis
X-Axis: Time-Based GEX Aggregation
- Displays cumulative negative net GEX values across multiple option expirations
- Shows data up to the selected strategy’s expiration date
- Helps identify whether aggregate GEX is positive or negative for specific expiration periods
- Enables traders to understand potential market pressure points in time

Y-Axis: Price-Based GEX Distribution
- Groups GEX values by strike prices for the selected expiration
- Visualizes net positive or negative GEX at specific price levels
- Helps identify potential support/resistance levels based on GEX concentration
- Shows where market maker hedging activity might be most significant

Practical Applications of NinjaSpread’s GEX Display
- Strategy Optimization
- Use GEX distributions to select optimal strike prices
- Identify expiration dates with favorable GEX profiles
- Adjust position sizing based on GEX concentration
- Fine-tune entry and exit points using GEX support/resistance levels
- Risk Assessment
- Evaluate potential market pressure points
- Identify periods of potential increased volatility
- Understand market maker positioning
- Assess hedging requirements at different price levels
- Market Analysis Integration
- Combine GEX analysis with technical indicators
- Use GEX levels to confirm support/resistance zones
- Identify potential price magnets based on GEX concentration
- Anticipate potential market maker behavior
Conclusion
GEX levels provide valuable insights into market dynamics and potential price behavior. However, they should be used as part of a comprehensive trading approach rather than in isolation. Understanding how GEX influences market movement can help traders make more informed decisions and better manage their risks.
- Options chain analysis tools
- Market maker behavior studies
- Risk management systems