There are several option strategies for earnings season. One of the most widely used is the calendar spread. This is because you can harness the IV skew between expirations using a calendar spread.
What is an IV skew? Approaching earnings, the IV of the front month always increases more than the back month. This is called horizontal IV skew or term structure (horizontal skew).
So when you buy a calendar spread you are shorting the front month with a higher IV and buying the back month with a lower IV, hence you trade the IV skew. After the earnings announcement, the front month’s IV always collapses. If the move of the underlying is not outside the boundary of the calendar spread’s breakeven, we can make a profit.
Depending on your outlook you can trade ATM or OTM calendars as well. If you think the stock is poised to move higher and you find a great R/R (reward-to-risk) calendar you can buy it and benefit from the IV skew.
If you think the stock will not move a lot, you can take advantage of the IV skew by buying an ATM calendar spread. Either way, you can use the calendar scanner of NinjaSpread to look for great IV skew and high R/R calendars.
Scanning for OTM call calendars
Let’s scan for OTM call calendars for stocks that will have earnings in the next 7 days with backwardated IV skew and at least 500% R/R. This is how I would set up the scanner.
Let’s look at all the input fields and why I have set them the way I did.
Ticker: “MY:ALL” means the scanner is looking for all the stocks that are included in the system.
Option: “call” means I am looking only for call calendar spreads.
Price: “0 – 500” means I am only interested in call calendars that have a debit between 0 and 500 dollars.
DTE: “0 – 21”, I am looking for the ones with max 21 days to expiration.
Front delta: “25 – 40” defines the delta distance for the front leg of the calendar spread. If you want to go for more OTM ones, you can set it to 0-20 for instance. If you are looking for more ATM calendars, set it to 45-55.
Delta: “-100 – 100” is the net delta of the position. This is the default setting, I haven’t changed it.
Expiration diff: “7”, means I am looking for time spreads where there are 7 days in between the expiration dates. You can also search for 14, 21, and 28 if you want, but the lower it is, the higher R/R you will find.
Skew: “-100 – 0”, this is the most crucial part of this setup, the horizontal IV skew. This setting states that I am looking for negative skew, which means the front leg has a higher IV than the back leg. I am always looking for a negative horizontal skew in a calendar spread configuration.
R/R: “500 – 10000” means I am looking for spreads that have a reward-to-risk ratio of at least 500%. The higher the IV skew, the higher the R/R gets.
Range: “0 – 100” defines how wide the breakeven range in percentage should be in a calendar spread. I left it on default.
Min. volume: “10” is looking for legs that have at least a volume of 10 on the current day. With this, you can filter out those that have very low volume, hence wider bid/ask spreads.
Earnings: “0 – 7”, looking for stocks that will have earnings in the next coming 7 days.
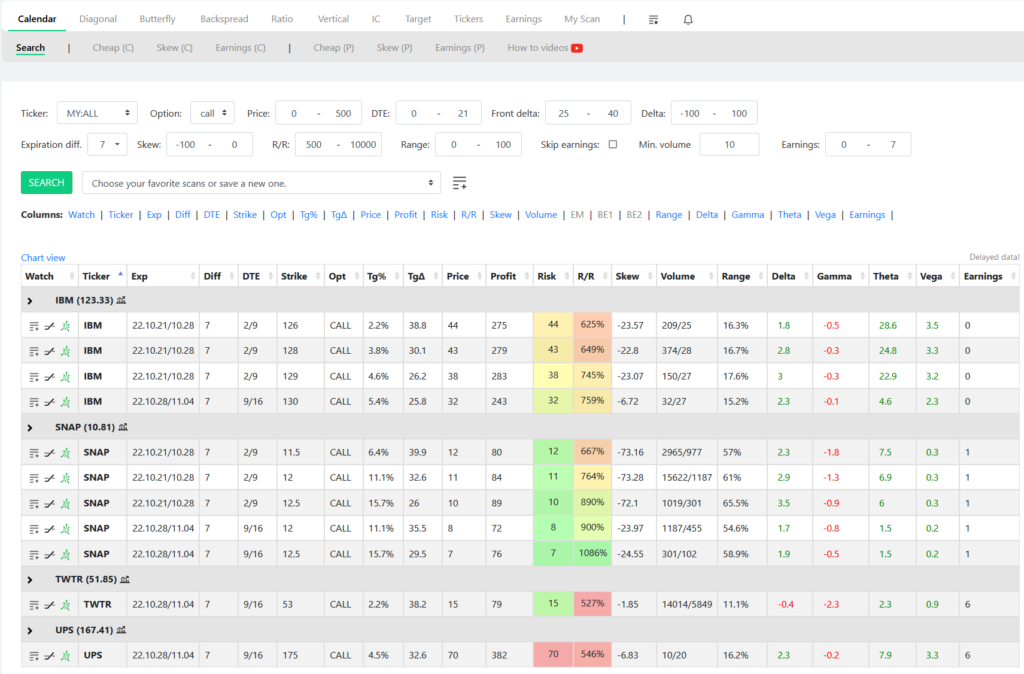
Here are the results of the above scan settings for today (10.19.2022).

As you can see from the image above I have only found 4 stocks with this high R/R expectation: IBM, SNAP, TWTR, UPS. They will all have earnings within seven days.
Let’s understand the table columns one by one.
Watch: with these icons you can add a spread to your watchlist, analyze the risk graph or copy the trade to thinkorswim format.
Ticker: nothing to explain here:)
Exp: the front and back month expiration of the calendar spread.
Diff: the day difference between the legs’ expiration dates.
DTE: how many days are until expiration in the front / back leg.
Strike: the found strike of the calendar spread.
Opt: option is either call or put.
Tg%: target %, how far the strike is in percentage move from the current stock price.
TgΔ: the target delta of the calendar spread which is the front delta in this case.
Price: debit of the calendar.
Profit: the theoretical max. profit you can make on the specific calendar spread.
Risk: the risk of the trade, in this case, the debit paid.
R/R: reward to risk in percentage.
Skew: the horizontal IV skew of the legs. Negative means it is backwardated that is the front leg has a higher IV than the back month.
Range: what is the price range in percentage between the breakeven points of the calendar (how wide is).
Delta: net delta of the spread.
Gamma: net gamma of the spread.
Theta: net theta of the spread.
Vega: net vega of the spread.
Earnings: days until the earning announcement.
Scanning for ATM call calendars
Now let’s see what we can find if I am scanning for ATM calendars with the same settings. Please note that the only thing I have changed is the Front delta being 45-55. I have found the same stocks but with different calendar configurations. Please see the image below.

You can obviously try the same scan for put options as well to see if they have wider IV skew, hence lower prices.
Calendar scanner guide
For a more detailed explanation of how to use the calendar spread scanner please watch the following video.
Follow for more ideas
If you are interested in more ways how to harness the power of the scanner, please subscribe below.