In this article, I would like to show you how to scan (and be alerted) for cheap SPX calendar spreads.
Let’s assume, that I am looking for a call calendar spread because I think that SPX will rise in the next 2-3 weeks. Right now SPX has option expirations every single day. So sometimes there are too many “options” to choose from.
The fewer days you have between expirations, the cheaper it gets. So what I am usually doing is scanning for SPX calendars with 1,2,3 day between expirations. But being cheap is one side of the equation, it also has to make sense in terms of the front delta. If it is too out of the money (OTM), it can be cheap but will have a low probability of success. I am trying to look for a calendar with at least 25 – 45 front delta and scan that range for calendar prices.
Here is how I would configure the scanner:

Ticker: “SPX”
Option: “call” means I am looking only for call calendar spreads.
Price: “0 – 250” means I am only interested in call calendars that have a debit between 0 and 250 dollars.
DTE: “0 – 30”, I am looking for the ones with max 30 day to expiration.
Front delta: “25 – 45” defines the delta of the front leg of the calendar spread. If you want to go for more OTM ones, you can set it to lower front delta. If you are looking for more ATM calendars, set it to 45-55.
Delta: “-100 – 100” is the net delta of the position. This is the default setting, I haven’t changed it.
Expiration diff: “1,2,3”, means I am looking for time spreads where there are 1, 2, or 3 days in between the expiration dates.
Skew: “-100 – 0”, this setting states that I am looking for negative skew, which means the front leg has a higher IV than the back leg. I am always looking for a negative horizontal skew in a calendar spread configuration because that makes it cheaper.
R/R: “100 – 10000” means I am looking for spreads that have a reward-to-risk ratio of at least 100%. The higher the IV skew, the higher the R/R gets.
Range: “0 – 100” defines how wide the breakeven range in percentage should be in a calendar spread. I left it on default.
Min. volume: “0” not filtering out any legs based on volume. SPX is pretty liquid on all strikes.
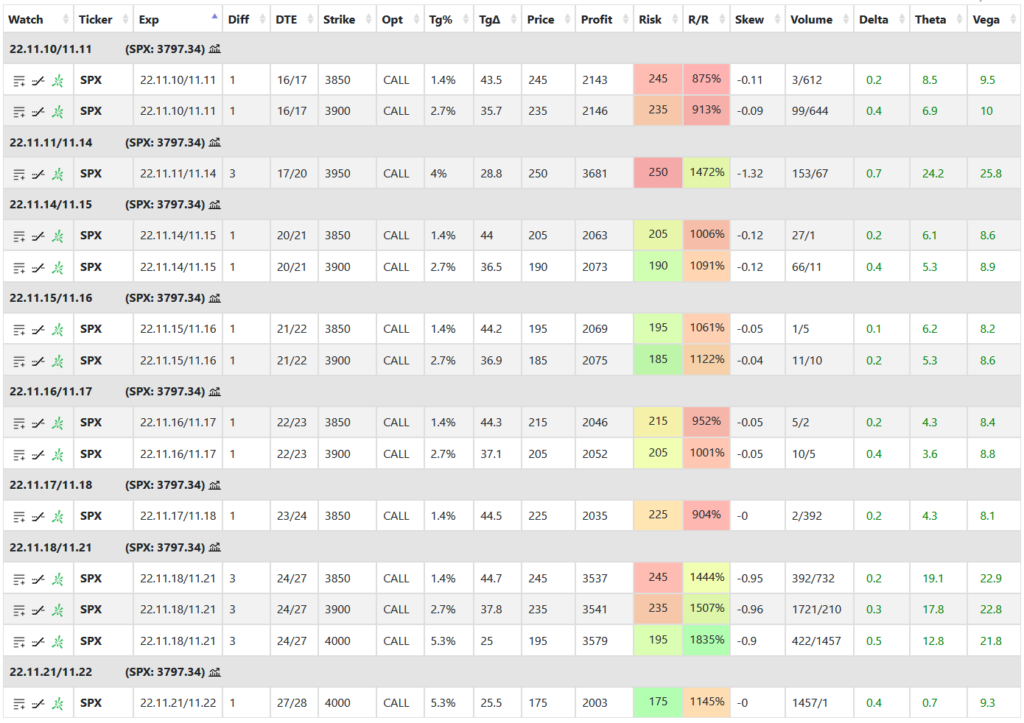
Let’s see the results in the following table.

As you can see from the image above I have found several expiration differences and strikes that match my criteria.
Let’s understand the table columns one by one.
Ticker: nothing to explain here:)
Exp: the front and back month expiration of the calendar spread.
Diff: the day difference between the legs’ expiration dates. As you can see, only 1 and 3 were found, and no expiration differences of 2 were found under $250 per contract, but that is fine.
DTE: how many days are until expiration in the front / back leg. I have found from 16 to 27 to choose from.
Strike: the found strike of the calendar spread. It ranges from 3850 to 4000 based on the front delta settings.
Opt: we are looking for call calendars.
Tg%: target %, how far the strike is in percentage move from the current SPX price. So if I think there is a huge move underway, I would shoot for the lowest result that has a 5.3% target percent and 1145% R/R.
TgΔ: the target delta of the calendar spread which is the front delta in this case. It ranges from 25 to 45 as we set in the criteria. The higher it is, the more ATM it gets and the more expensive as well.
Price: debit of the calendar.
Profit: the theoretical max. profit you can make on the specific calendar spread at expiration.
Risk: the risk of the trade, in this case, the debit paid.
R/R: reward-to-risk in percentage. The higher it is, the more you can theoretically make compared to the risk you take on.
Skew: the horizontal IV skew of the legs. Negative means it is backwardated that is the front leg has a higher IV than the back month.
Range: what is the price range in percentage between the breakeven points of the calendar (how wide is it).
Delta: net delta of the spread.
Theta: net theta of the spread.
Vega: net vega of the spread.
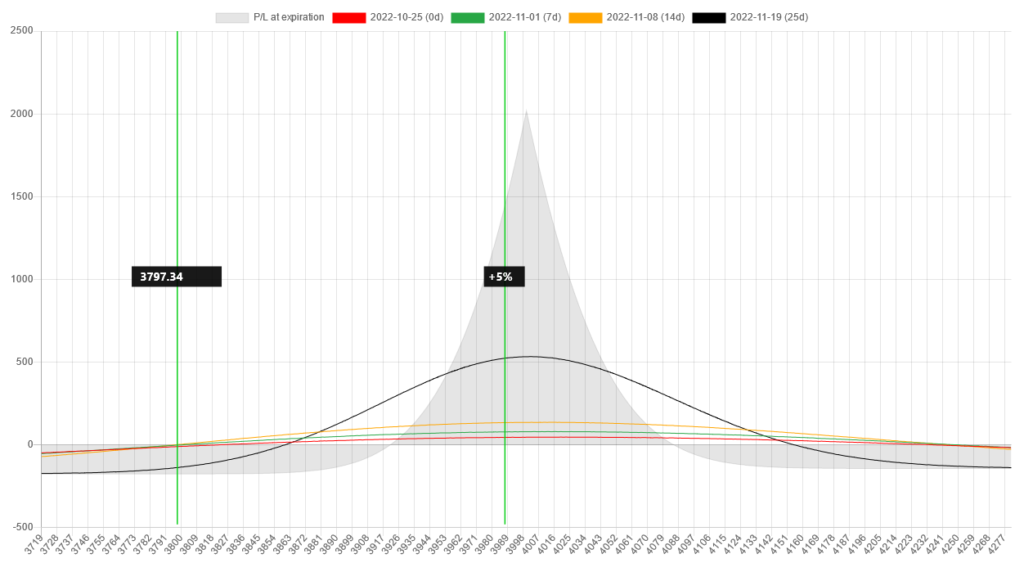
You can sort the table by any columns to see the highest and lowest values if you want. If I sort the table by price, I can see that the cheapest SPX call calendar right now is $175 with a front delta of 25.5 and a strike of 4000. If that meets my criteria, I can further check its risk graph by clicking on the icon.
Here is the risk graph of the spread.

Let’s get notified
I can save this scan as a favorite and later on reuse it or enable an alert and get notified whenever there is a new one found in the market.
If you click on ![]() icon you can name this scan:
icon you can name this scan:

I have named it “Cheap SPX”. After saving it, you can select it from the dropdown list and if you click on the ![]() icon an alert is enabled for this scan. It means that the scanner will search the market every 5 minutes to look for spreads that meet these criteria.
icon an alert is enabled for this scan. It means that the scanner will search the market every 5 minutes to look for spreads that meet these criteria.

If anything is found, you get an email about it. Don’t worry, it will not spam you with the same spreads every 5 minutes. After a spread is found and sent via email, only new ones will be sent afterward.
If you want to be notified only about really cheap ones, you can set the price to $150, and probably there will be no results. Don’t worry, just save the scan and enable the alert button. If you do this, the scanner will look for SPX call calendars under $150 and will send you an email when the market condition is right for that. This way you can be instantly notified if there is a significant discount in the market on any strategy or stock.
Follow for more ideas
If you are interested in more ways how to harness the power of the scanner, please subscribe below.